Sunday, August 25, 2013

Data Science: Definition and Opportunities


Image courtesy of BBC
My thoughts on what data science is, what skills data scientists have, what are the current issues in the Business Intelligence pipeline, how can machine learning automate a part of the BI chain, why and how data science should be democratized and made available to every one including decision makers (business users), how business analyst should build complex data models and how data scientists should be freed up from the mundane tasks of rinse and repeat ETL before building models that provide input for decision making, how companies can build a business practice around data science. 

Key Premise: big data is all data and the big data apps offer the ability to combine all data (public + private) and expand the horizon to discover more meaningful insights.

Data Science is:
  • An art of mining large quantities of data 
  • An art of combining disparate data sources and blending public data with corporate data
  • Forming hypothesis to solve hard problems
  • Building models to solve current problems and provide forecast
  • Anticipate future events (based on historical data) and provide correcting actions (finance, banking, travel, operational runtime)
  • Automating the processes to reduce time to solve future problems
A Data Scientists has following minimum set of core skills:
  • Problem-Solver
  • Creative and can form an hypothesis
  • Is able to program with large quantities of data
  • Can think of bringing data from appropriate data source and can bring and blend data 
  • Stats/math/analytics background to build models and write algorithms 
  • Can quickly develop domain knowledge to understand key factors which influence the performance of a busies problem
Roles Data Scientists play:
  • Problem description 
  • Hypothesis formation
  • Data assembly, ETL and data integration role
  • Model development (pattern recognition or any other model to provide answers) and training
  • Data visualization 
  • AB Testing 
  • Propose solutions and/or new business idea
The balance between human vs. machines:
  • Current: humans play a significant role in the process – ETL, joins, models, visualization, machine-learning and repeating and recycling this process as the problem changes
  • Tomorrow: A big portion of the food-chain can be automated via machine learning so machines can take over and scientists can free up to build more algorithms/models 
  • The process can be automated so repeating/recycling can be cheaper and less time consuming
The Data Science pipeline currently look like:
  • From Data to Insights – this entire process requires mundane skills (IT),  specialized skills (data-scientist) and elements of human psychology to present the right information at right time 
  • The data needs to be discovered, assembled, semantically enriched and anchored to a business logic – this task can be be automated through machine learning (a set of harmonized tools with AI) to free up scarce resources
  • Specialized skills today get addressed by open source technologies such as R and expensive solutions like Matlab and SPSS.
  • Very few software solution carefully introduce human interface to make their application consumable without requiring customer training
This pipeline needs complete rethinking:
  • Automate mundane tasks that IT gets tagged with 
  • Discover data automatically 
  • Detach business logic from data models
  • Make blending public data with corporate data a second nature
  • Free up scientists so that they can build analytics micro-apps for a domain or a sub-domain
  • Data Science need not be a niche (specialized category), it should appeal to the masses (democratization of data and brining insights to everyone without needing specialized skills)
    Opportunities in Data Science: 
    • Understand the value chain (IT + Business Analyst + Data Scientists + Business Users)
    • Provide something for everyone  - a single integrated platform (ETL + Data Integration + Predictive modeling + in-memory computing +  storage)  for data-scientist so that they can build standard analytical apps and move away from proprietary models and standardize (helps IT)
    • Analytical apps on this platform (think of them as Rapid Deployment Solutions) for business users
    • Help business analysts write basic models (churn, segmentation, correlation etc.) without needing advanced skills
    • Work with consulting companies so that they can consult and build apps for companies that do not have data scientist on their pay-roll (Mu-Sigma and Opera Solutions)
    • Partner with public data provider (to help clients), consulting companies (Rapid Solutions solution), R/Python/ML communities (mind-share and thought-leadership), 
    • Donate your predictive models to open-source communities

      Tuesday, August 13, 2013

      Sum of Parts Valuation Analysis for Apple from Needham

      Sum of parts is greater than the whole - when one gets an indication that company as a whole is not priced fairly, break the company down into parts and apply sum-of-parts valuation.

      The sum-of-parts valuation approach Needham used below to value Apple is my favorite one.  This approach breaks down the organization into parts and applies separate valuation model using different growth assumptions, challenges and steady-state values to arrive to an appropriate LTV.  In this approach, the fastest growing businesses can fetch aggressive growth rates while slower or steady business get more moderate assumptions.


      Friday, April 19, 2013

      Democratization of Business Analytics Dashboards

      I am super impressed with the following visual dashboard from IPL T20 tournament - IPL 2013 in Numbers.  For those of you not so familiar with cricket or IPL, IPL is the biggest, the most extravagant and the most lucrative cricket tournament in the world.  I like the way IPL is bringing sports analytics to the common masses.


      What is impressive is that each metric (runs, wickets, or tweets) is live so these numbers get updated automatically, pretty cool for IPL and cricket fans.  Also, each metric is clickable so one can drill down to his or her heart's content.  This is a common roll-up analysis but the visualization and the real time updates make this dashboard pretty appealing.  IPL team, thanks for not putting any dials on this dashboard (LOL).

      I have been influencing and now building analytics products that power these sports and various other dashboards/reports for many years.  The most fascinating thing is that these dashboards (or lets call it analytics in general) are reaching the masses like never before.  Everyone has heard of terms like democratization of data and humanization of analytics.  This is it!  The data revolution is underway.  

      Now, there are many new frontiers to go after and the existing ones need to be reinvented.  Yes, the analytics market is ready for massive disruption.  This is what keeps me excited about Business Analytics space.

      Happy Analyzing and Happy Friday!

      Friday, April 5, 2013

      Tableau IPO: Let The Gold Rush Begin For Enterprise Software IPOs!


      The year 2013 is going to be the year of enterprise software IPOs.  That is not a prediction but well discussed point in Silicon Valley.  Everybody believes that there is a pent-up demand from return hungry investors for the enterprise software IPOs.  Consumer software IPOs have failed to live up to their promise in the last couple of years but the enterprise software IPOs have continued to deliver (examples: WDAY, NOW, SPLK), case-in-point.   

      In the last couple of days, two of my favorite companies, Marketo and Tableau have announced plans to go public.  Here are the links to Marketo's S1 and Tableau's S1.  I have had the good fortune to study, evaluate and follow both companies since 2010.  Both the companies have done very well in their respective segments, SaaS marketing automation and on-premise self-serve BI.  They have both exceeded expectations on all fronts (employees, customers, analyst  markets, competitors) after a long hard slog.  

      To all my friends, colleagues, investors and readers of this blog, enterprise software is a hard slog, you are in it for a long-haul.  Tableau is a 10-year old company and Marketo is 7 years old (Source:  SEC Filings).

      Valuation
      Since Tableau ("DATA") has announced its plan to go IPO this year, I decided to put the striped-down version of my due-diligence, performed in early 2011, on my slide-share account.  Back then, I used relative valuation using QlikView ("QLIK") as a close proxy to put a number on Tableau.  I used PE (earnings multiple) and PS (revenue multiple) of QLIK and assessed a market value of $380million based on Tableau's 2010 revenues of $40 million (from their press release in 2011, this number has been revised down to $34million in S1, huh, strange!)

      Now, if one were to use QLIK's current revenue multiple of 5.5 (Source: Yahoo Finance), Tableau could be valued between $700million (based on trailing revenue of $128million) and 1.4billion (based on  $256million in expected revenue for 2013 assuming that they grow their revenue YET AGAIN by 100% in 2013.)

      I personally don't think that the street should use QLIK as a proxy instead apply Splunk's ("SPLK") lens to value Tableau.  So using SPLK's multiple of ~19.7 (Source: Yahoo Finance), Tableau will be valued at $2.5billion based on their 2012 revenues.  ServiceNow ("NOW") also has a PS multiple of ~19. 

      I have strong reasons to believe that street will be valuing Tableau in this range based on a great growth story till this point and amazing opportunities ahead as we are just starting to drill the BigData mountain.  I will not be surprised to see the valuation range from $2.5billion to $5billion. Amazing!

      Tableau's S1
      I studied Tableau's S1 filing briefly looking for information on valuation and offering on number of shares.  Not much is disclosed there just yet.  It will likely be disclosed in the subsequent filings as they hit the roadshow to assess the demand from the institutional investors.  Just like Workday, Tableau will also have dual class shares (Class A and Class B) with different voting rights.  The Class A will be offered to investors by converting the Class B shares. 

      The last internal valuation of employee options priced the stock at ~$15.  To raise $150million, Tableau will at least be putting 10 million shares of Class A on the block.  Now of course, this will change as the demand starts to build up following their road-show.  One thing is certain that the stock will be definitely priced above $15.  Now, how many points above $15, we will find out in the next few months.  

      Let the mad rush begin!!!

      Friday, November 9, 2012

      Financial Markets and President Elect: Do Financial Markets Favor A Republican Over A Democrat?

      US financial markets favor a republican president over a democratic president. Has this sentiment stood the test of time?  Do financial markets care whether the president elect is a democrat or a republican?  How have financial markets behaved in the past after the announcement of next US president?  And finally, can one spot a pattern in the performance of financial markets based on the president's party affiliation?  More specifically, did financial markets fare better under a republican president or under a democratic president?

      To answer all these questions, I turned to history and generated the historical performance of S&P 500 since 1952.  I also had to turn to Wikipedia to get a list of presidents and their party affiliation.  Between 1952 and 2012, US has elected 16 presidents with republican presidents outnumbering their democratic counterparts by 2 in occupying the white house (see table below):

      To understand whether financial markets favored a republican president over a democratic president, I generated 1-day, 1-week, 4-week, 12-week, 52-week and the presidency term ("term") returns since the election date (see table above.)  Looking at the one day return, there was no clear indication whether markets favored one party or the other.  Financial markets welcomed Ronald Reagan, a republican, by sending the S&P 500 up 1.77% which is the highest one-day return among all the 16 presidential events.  Markets also cheered the reelection of Bill Clinton with a one-day return of 1.46% after the announcement of president elect.

      Source: AllThingsAnalytics
      With one-day returns of -5.27% and -2.37% in 2008 and 2012 respectively, President Obama is not much favored by financial markets.  Now, one can argue that October 2008 was a terrible period for anyone to be elected as the president because of the ongoing crash in financial markets that led to the great recession (see side chart.)  Nonetheless, markets also didn't like Obama's reelection (S&P 500 was down 2.37% following the election day) which leads to a status quo in Washington.  Combine that with all the ongoing macro concerns including the Euro debt crisis and already unraveling fiscal cliff, investors have become very jittery in the past couple of days.

      Now, to overcome the short-term bias in financial market's reaction, let's review other period's returns (see table above.)  There are plenty of interesting observations one can make.  For example, under both of Clinton's (Democrat) presidencies, financial markets boomed with returns of 56% and 111% over the next 200 weeks since the election day.  Eisenhower's (Republican) presidency came second with returns of 95% and 19%.  Reagan era followed by Bush Sr's term also produced hefty gains for investors with returns of 28%, 56% and 49% under their terms.  Again, there is no clear indication whether financial markets favored one party over the other during a president's term in the office but financial markets definitely fared well under a republican president prior to 2000.

      Bush Jr. (Republican) inherited dot-com crash, oversaw the biggest expansion in US public debt (see chart below) and observed the epic housing crisis of 2007-2008.  Financial markets yielded returns of -22% and 13% during Bush's two terms presidency, pretty poor for a republican president who unleashed all the expansionary polices on US economy.  Under Bush's 8 year presidency, US public debt doubled from $5.6 trillion to $10 trillion.  Obama added almost the same level of debt in just 4 years and took US public debt from $10 trillion to $14.2 trillion by the end of 2011.

      Source: AllThingsAnalytics


      From Wikipedia, click to expand


      Are we living in times which have no historical precedence?  It took 20 years for US public debt to rise from $1 trillion level to $5.5 trillion level (see side chart).  It then just took 11 short years for US public debt to rise to $14 trillion level.  From year 1980 to 2000, S&P 500 appreciated by 1276% (from 105 at the start of 1980 to 1455 at the start of 2000). Astonishing rise!!!   Also astonishing is the fact that since 2000 till date, S&P 500 has been down -5%.  Has the mammoth economic expansion of 1980s and 1990s run its course and now debt is the only route left to sustain US economy.  Let's leave this discussion for another blog.


      Financial markets care less which party's candidate is elected for the white house and focus more on the economic policies that president will enact.  All the rhetoric and party ideology does take a toll on financial markets though as evident in financial markets' immediate reaction similar to the one we are observing right now.  Hopefully, the congress and the president will put the rhetoric aside and break the impasse on the already unraveling fiscal cliff.

      This blog has benefited from discussions with Jens DoerpmundRyan Leask and Rajani Aswani on this topic.

      Disclaimer:  All numbers are approximate and the underlying analysis is preliminary.  This blog is not intended for offering any investment advice.

      Sunday, October 28, 2012

      Apple, SAP & Hewlett-Packard: Not Just Numbers, Company's Vision, Strategy and Goals Also Matter For Investors (Part II)

      Part I of this two-part blog offered empirical evidence suggesting that few consistently outperforming technology companies (such as AAPL and GOOG) get valuation treatments that defy conventional wisdom.  Part I ended by introducing an investment approach that was based on three simple rules and suggested that management's effectiveness in articulating its corporate vision and goals and its trustworthiness also plays a critical role in winning investors' sentiment.  Let's put each company through this test in part II of this blog and discuss the outcome.

      First up, AAPL:  For AAPL, I can safely conclude that the first two rules are securely in the bag.  Investors understand the company and its hugely popular products.  It has successfully sailed with the wind for the past decade and I might even argue that it brought fresh wind in the sails of tablets and smart phone segments.  But when it comes to applying the third and final rule, i.e.  investing in AAPL for the mid-to-long term, and thus paying a reasonable multiple, investors are certainly hesitating to act.  From investors’ point of view, the investment decision boils down to following two points:
      •  AAPL gets fresh lease of life every year when it upgrades its iLine (iPads, iPhones, iPods and Macs) of products;
      • But other than this routine, AAPL management is highly secretive about its vision for the future of AAPL.
      For AAPL investors, it is challenging to see beyond a one year horizon.  The investors are asking larger questions to AAPL including:  a) what does AAPL want to be in 5 years and where will it be?  b) Will AAPL dominate some market segments as it does today, if so, what is that longer-term strategy?  Until, AAPL addresses these questions and clearly articulates its strategy and the goals tied to its strategy, it will be hard to see why investors would apply SP500 like or higher multiples on AAPL.

      Next up, ORCL: For ORCL, I would start by arguing that ORCL is suffering from a credibility problem with the investors.  Investors get ORCL’s enterprise software and hardware business which is attractive and growing at a secular rate.  ORCL has accepted that inorganic growth model (via acquisition) is the way to move its business forward and stay current on the technology innovation front.   Besides all this, its earlier position on cloud technologies (calling it a fad) and then turning into a true cloud believer (with the acquisition of RightNow, Taleo and its own investments) has sent mixed messages to investors. 

      ORCL has done a poor job of laying out its long-term vision for investors and investors are unhappy because they are unable to see a clear path forward.  Does ORCL want to be like its big brethren IBM and package hardware, software, services and cloud infrastructure together for its customers?  What does ORCL want to be?  What are some of its growth plays?  ORCL has attempted to articulate its vision to investors and analysts but the reduced trustworthiness and the past delays in strategic investments have kept investors skeptical at best.  ORCL needs to win the credibility back from its investors and shy away from sending mixed messages to investors and its own customers.

      Next up, HPQ:  I don’t know where to begin with this company.  Let’s start at the very top, the board. HPQ’s board has had major credibility issues for many years now because of the scandals and terrible decisions that have resulted in billions of dollars of losses for investors.  The epic stumbles such as the launch of Palm based tablets/smart phones (and then the immediate pull out), public display of flip-flopping decisions on spin-off for Personal Computer unit and then having three CEOs at the helm of HPQ in less than three years has not pleased investors. 

      In addition, HPQ’s core businesses continue to suffer resulting in heavy losses because it has been slow to respond to the shift in technology spending to cloud and mobile technologies.  HPQ’s market cap has dropped by more than 80% since peaking at approximately $120B in 2010.  Investors have little to no confidence in HPQ and are pricing in rapid erosion of its customer base and sales (which is reflected in a low price/sales ratio of 0.23.)

      Next up, GOOG:  GOOG has wide range of interests resulting in a large array of investments including the investment in driver-less cars.  Not all the projects GOOG has undertaken in recent years have been positive NPV projects and as a result GOOG’s stock has same P/E multiples as that of SP500.  GOOG wants to be a technology company and all the investments GOOG makes have this common origin.  This is a fact but why investors are not comfortable with it?  Is GOOG not effective at convincing investors that this approach is right and will bear fruits?

      Is GOOG going to be a media company, or a mobile company, or a hardware company, or an Internet bandwidth company, or a search company or an enterprise software company or all of the above (i.e. a tech conglomerate)?  Apparently, GOOG’s vision and  roadmap are not very clear to investors which is why GOOG had lackluster performance for the first six months of 2012 prior to Q2’s earnings announcement.  I believe that investors have adopted a wait and watch approach on GOOG which is a mature company now but surrounds itself with a high number of uncertainties.

      Next up, IBM:  IBM is securely in the bag using the rules I laid out in Part-I.  By 2015, IBM will generate $20 in non-GAAP EPS - this is IBM’s corporate goal for 2015.  I believe that investors should love the simplicity of IBM’s singular goal.  IBM has done a nicejob in articulating its corporate goal for 2015 including the key growth plays that will drive IBM forward to its goal.  The key growth plays from IBM are emerging markets, Analytics, Cloud and Smart Planet initiatives.  IBM has also articulated that it will pursue higher-margin opportunities (i.e. software) and use share repurchase programs to boost EPS.  IBM’s EPS in 2011 was $13.4 which would have to rise by 50% in 4 years if IBM were to accomplish its goal of producing $20 EPS by 2015.

      Both AAPL and IBM are iconic and trusted brands.  IBM has provided a clear vision and a path forward but AAPL has not, therefore I am not surprised to see that both IBM and AAPL received similar Trailing and Forward P/E multiples despite the fact that AAPL’s earnings growth is nothing less than spectacular.

      This brings me to the last company I will discuss here, SAP:   Just like IBM, SAP is also securely in the bag.  SAP is a global brand and plans to reach 1 billion people in an attempt to become a household name.  I have found SAP to be a goals driven company and it is taking all the necessary steps (both organic and inorganic growth opportunities) to track towards these goals.  This is similar to IBM’s approach but more clearly spelled out.  Here are the goals that SAP has laid out for 2015 on its corporate website:

      Source: SAP' Corporate Website

      Additionally, just like IBM, SAP has also clearly articulated its growth strategy and the five market categories it plans to expand into.  These categories are: applications, analytics, mobile, database & technology, and the cloud.  SAP’s management has not sent mixed messages to the market (unlike ORCL) since sharing its vision and goals for the future and is gearing up to ride both the mobile (with Sybase and Syclo acquisitions) and the cloud trends (with SuccessFactor and Ariba acquisitions).  

      SAP is not the only company growing its revenues at a double digit rate for more than 10 quarters, but it is logging that performance on a consistent basis and tracking towards its 2015 corporate goals.  Investors are cheering this steady performance and have bid up the stock by more than 35% YTD in 2012, higher than every other stock in the group except AAPL (see the graphics below):
        
      Source: Google Finance

      Majority of the public companies, if not all, develop a vision, lay out a clear strategy and announce goals to realize that vision.  But some do a better job than others in articulating and sharing this on a regular basis with their investors.  Companies that clearly articulate their vision and strategy to all their constituents including customers, employees, partners and investors earn respect almost instantaneously.  And when these companies publicly track progress against their vision, they benefit tremendously by winning the trust and credibility from each and every constituent (including investors) allowing them to attract top talent, new customers, new partners and new markets to help them grow their business. 

      This blog has benefited from the discussions with my friends and colleagues Jens DoerpmundRyan Leask and Rajani Aswani on this topic.

      Disclaimer:  All numbers are approximate and the underlying analysis is preliminary.  This blog is not intended for offering any investment advice.  SAP is my employer but all the views and opinions expressed here are solely mine.

      Apple, SAP & Hewlett-Packard: Not Just Numbers, Company's Vision, Strategy and Goals Also Matter For Investors (Part I)

      In this two-part blog, I will share my view points on why investors price certain stocks at higher or lower multiples against market defying conventional wisdom which suggests that higher (lower) growth stocks should fetch higher (lower) multiples than that of the market.  

      In part I of this two-part blog, I offer empirical evidence suggesting that few consistently outperforming technology companies get valuation treatments that defy conventional wisdom.  Faster growing companies get lower multiples while slow and steadily growing companies get higher multiples.  

      In part II of this blog, I will conclude by suggesting that a clearly articulated long term strategy along with measurable corporate goals play an equally important role together with the company’s financial track record and market beating performance in winning investors' heart (and getting higher multiples.)  

      To help me illustrate my view points, I assembled a small group of traditional tech companies including Apple (Ticker: AAPL), Oracle (Ticker: ORCL), Hewlett-Packard (Ticker: HPQ), Microsoft (Ticker: MSFT), IBM (Ticker: IBM), SAP (Ticker: SAP), and Google (Ticker: GOOG).  I selected S&P 500 (SP500) as the market.  

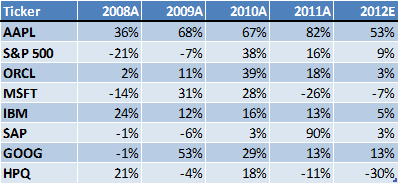
      As of Oct 19, SP500’s Trailing P/E and estimates for Forward P/E were 17 and 13.8 respectively (see the side table.)  AAPL’s 52-weeks return of 50.5% has markedly outpaced the same period return of 9.95% for SP500.  In addition, AAPL’s earnings growth has substantively outpaced that of SP 500 for five straight years (see the side chart). So I started to wonder why AAPL’s Trailing and Forward PE multiples of 14.3 and 11.4 trail that of S&P 500 (see the table below).  Is there a crisis looming for AAPL that could be bigger in magnitude and impact than those faced by the financial markets including the never-ending debt crisis in Europe, a worsening slowdown in China and an already unraveling fiscal cliff in the US.  So, why are investors not pricing AAPL using the multiples of SP500 at the minimum?

      Consider SAP:  In a peer group comprising of  four enterprise software tech companies - SAP, IBM, ORCL and MSFT, SAP has the highest Trailing P/E and the highest Price/Sales ratio (see the table below).  SAP’s Forward P/E of 19.7 is 9 points higher than that of ORCL, 11 points higher than that of MSFT and 8 points higher than that of IBM.  In addition, SAP’s Forward and Trailing P/E multiples are also higher than that of SP500!  So, why investors are willing to price SAP stock at higher multiples than the others in its peer group including the SP500.  Interestingly, SAP’s multiples are also higher than that of AAPL.  


      Finally, let’s drop HPQ into the mix:  HPQ’s TTM revenue was $61.9 per share (see the table above).  Its stock is trading at a meager P/S multiple of .2x and has a Forward P/E multiple of just 4.  This is not hard to explain as there is no love left between HPQ and its investors who have suffered heavy losses in HPQ which has dropped almost 50% just this year alone.  In addition, at such lower multiples, investors are definitely pricing in a catastrophic scenario.

      Source: Morning Star and Yahoo Finance
      For all these companies, I assembled last 5 years income statements and I reviewed their revenue growth rates (see the side table).  Nothing jumped out that could have suggested why AAPL should have lower multiples than the SP500, GOOG or  SAP.  Clearly, there is something else at play which traditional valuation approach is not explaining.


      Investors’ actions in HPQ, AAPL, SAP and its peers can be justified by applying following three simple rules of investment: 
      1. invest in companies you know, understand and believe;
      2.  invest in companies which are going to persist, pursue positive NPV projects and successfully sail with the wind (market trends); &
      3. invest in companies for mid-long term.
       Investors closely scrutinize, more than one would desire, the company management’s effectiveness in articulating its future and corporate goals and the trustworthiness.  This is where the “believe” part in the first rule comes in.  In part II of this blog, I will apply this set of principles to few companies in this group and discuss the outcome.

      This blog has benefited from the discussions with my friends and colleagues Jens DoerpmundRyan Leask and Rajani Aswani on this topic.

      Disclaimer:  All numbers are approximate and the underlying analysis is preliminary.  This blog is not intended for offering any investment advice.  SAP is my employer but all the views and opinions expressed here are solely mine.